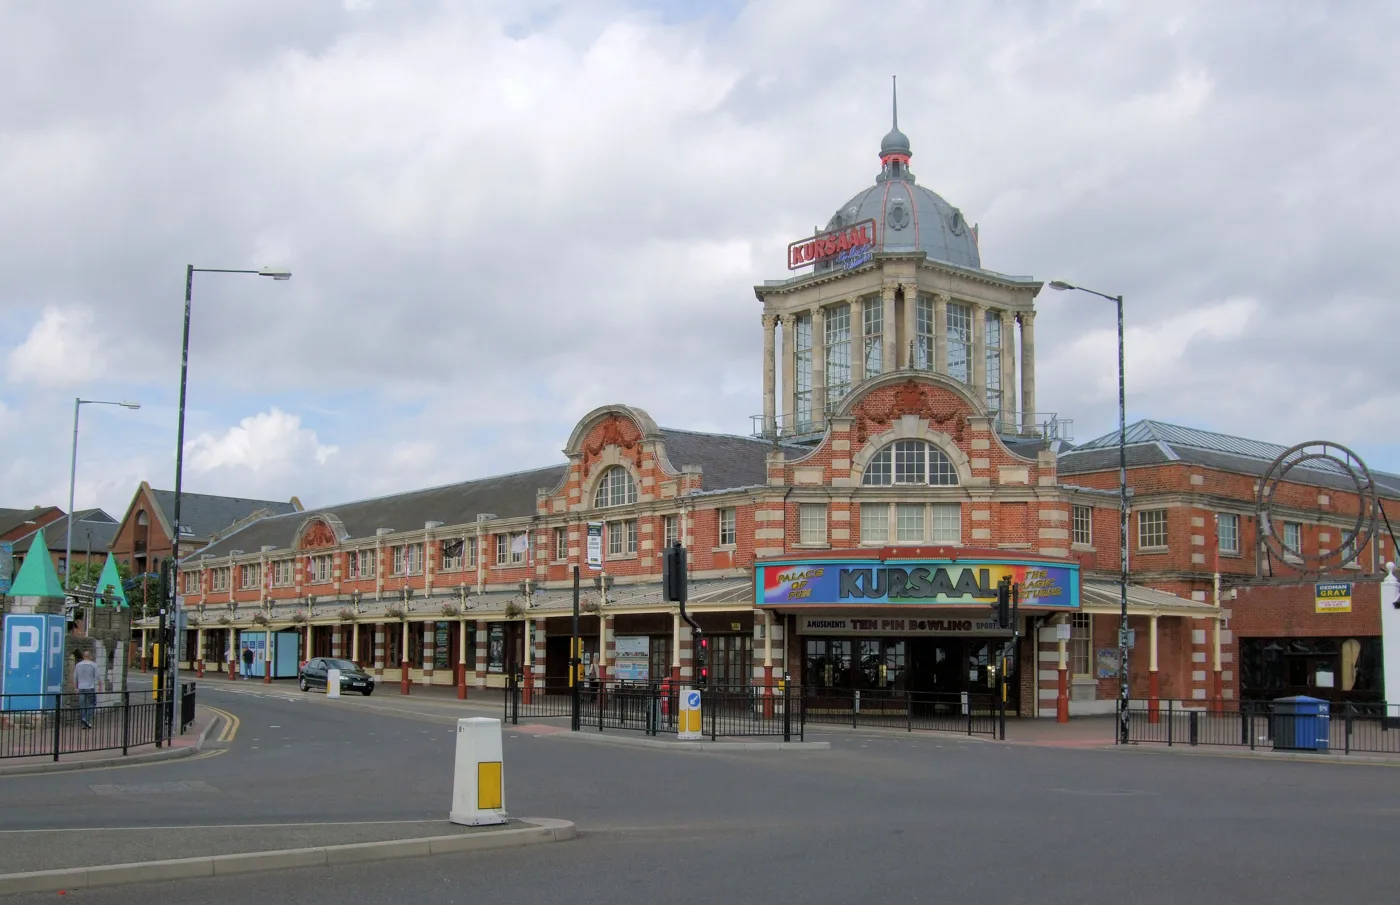

Southend's claimant count rose by 180 to 4,890 in October, the biggest one-month rise since July 2024. Kursaal is still the highest ward at 8.2%.
4,890 people in Southend were claiming unemployment-related benefits in October, 180 more than in September. That is 4.3% of residents aged 16 to 64. It is the biggest one-month rise in the city since July 2024 (claimant count, ONS via nomis).
The October figure is provisional. The Office for National Statistics revises the latest month when the next release comes out, and Southend’s figures have moved by more than 80 before.
Overview
- October 2026: 4,890 claimants, 4.3% of 16 to 64 year olds.
- On the month: up 180 from 4,710 in September, a rise of 3.8%.
- On the year: up 85 from 4,805 in October 2025.
- Over two years: down 310 from 5,200 in October 2024.
- Highest ward: Kursaal, 700 claimants, 8.2%. Lowest: West Leigh, 85 claimants, 1.5%.
A sharp month after a quiet summer
Southend’s count drifted down through the spring and summer. It fell from 4,980 in March to 4,690 in July, then held at 4,710 in August and September. October’s rise takes it back to roughly where it stood in the spring.
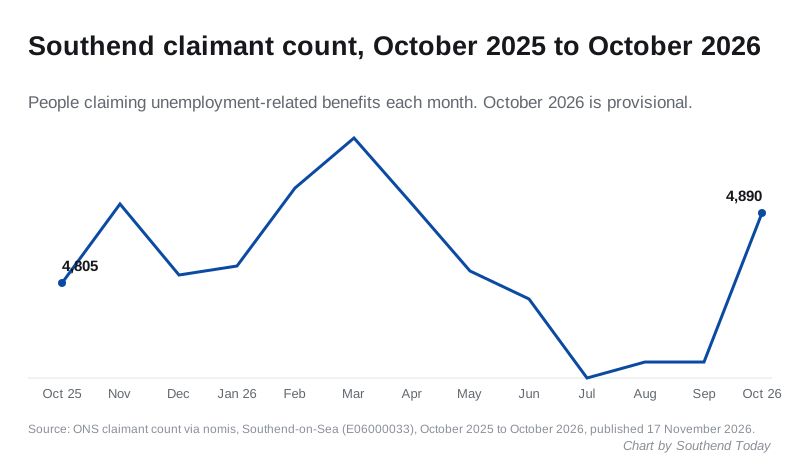
The longer view is steadier. The total is 85 higher than a year ago, and 310 lower than in October 2024. It is still above the 4,305 recorded in February 2020, the last month before the pandemic.
Who is claiming
The rise in October was spread across every age group, but most of it came from people aged 25 to 49:
| Age group | September 2026 | October 2026 | Change on the month | October 2025 |
|---|---|---|---|---|
| 16 to 24 | 945 | 980 | +35 | 970 |
| 25 to 49 | 2,615 | 2,735 | +120 | 2,725 |
| 50 and over | 1,155 | 1,175 | +20 | 1,110 |
Over the year, the clearest change is among the over-50s. Their count is up 65, from 1,110 to 1,175.
Men still make up most of the total: 2,815 men (5.0% of working-age men) against 2,070 women (3.6%). The monthly rise was larger among women, up 105 from 1,965, while the count of men rose by 65 from 2,750.
Every Southend ward
The ward figures come from the same release (ward claimant counts, ONS via nomis). Wards were redrawn for 2024, and ONS publishes them on the current boundaries from January 2026, so the change column covers nine months. Every ward figure is rounded to the nearest five.
| Ward | Claimants, October 2026 | % of 16-64s | Change since January |
|---|---|---|---|
| Kursaal | 700 | 8.2% | -45 |
| Milton | 620 | 7.4% | +5 |
| Victoria | 610 | 6.4% | +10 |
| Westborough | 380 | 4.9% | -30 |
| St Luke’s | 320 | 4.4% | +35 |
| West Shoebury | 250 | 4.2% | 0 |
| Shoeburyness | 290 | 4.1% | +15 |
| Chalkwell | 250 | 4.0% | +5 |
| Blenheim Park | 245 | 3.6% | +25 |
| Southchurch | 210 | 3.5% | -5 |
| Prittlewell | 220 | 3.3% | -10 |
| St Laurence | 205 | 3.3% | +20 |
| Belfairs | 130 | 2.6% | +25 |
| Leigh | 150 | 2.3% | +5 |
| Thorpe | 110 | 2.2% | +10 |
| Eastwood Park | 115 | 2.1% | 0 |
| West Leigh | 85 | 1.5% | -5 |
Kursaal, Milton and Victoria, three neighbouring wards in the centre of the city, hold 1,930 of the 4,890 claimants between them. That is 39% of Southend’s total.
Kursaal has the most claimants of any ward but also the biggest fall since January, down 45. St Luke’s has risen most, by 35.
What it means for you
The claimant count is not the same as unemployment. It counts people claiming Jobseeker’s Allowance, and people on Universal Credit who are required to look for work. Some of them are in work on low earnings. A rise can mean more people out of work, or more people on low pay being asked to look for more hours.
If you have lost work or had your hours cut, the government’s benefits calculators show what you may be able to claim.
The November figures are due on Thursday 17 December. We will report whether October’s rise holds once ONS has revised it.
Revision note: our story on the July figures said 4,775 people were claiming in July. ONS has since revised July to 4,690. The figures above use the revised numbers.
Have your say