
Southend's average home was worth £327,570 in September, up 1.8% in a year and fourth fastest of 14 Essex areas. Prices rose in the month while England's fell.
The average Southend home was worth £327,570 in September, £5,796 more than a year earlier. That is a rise of 1.8%, the fourth fastest of Essex’s 14 council areas.
The figures come from the HM Land Registry UK House Price Index, published on 18 November. Prices in Southend rose 0.9% in the month, by £2,929. Over the same month, prices fell 0.4% across England and 0.2% across the East of England.
The index average is a mean, not a median. Expensive sales pull it up, so it is not what a typical Southend home sells for. It is a good guide to which way prices are moving.
A wobble in August, then a recovery
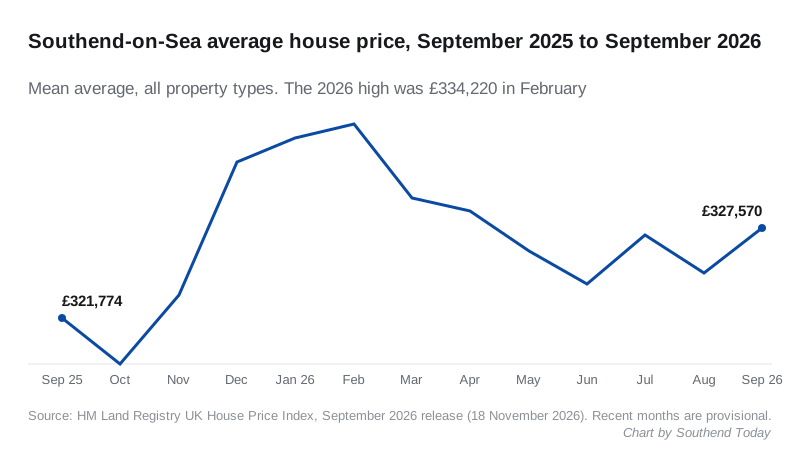
September undoes a dip. In the same release, the August figure stands at £324,641. That was 0.5% lower than in August 2025, Southend’s first fall on the year since October 2025.
The 2026 high is still February, at £334,220. September’s average is £6,650 below it. The all-time high in the index remains November 2022, at £340,088.
Houses up, flats still down
| Property type | Average price, September 2026 | Change on a year |
|---|---|---|
| Detached | £643,067 | +2.4% (+£15,112) |
| Semi-detached | £429,376 | +3.2% (+£13,476) |
| Terraced | £333,557 | +2.6% (+£8,591) |
| Flat or maisonette | £198,138 | -0.4% (-£790) |
Flats are again the only type worth less than a year ago, as on our Southend house prices page, though the gap is narrowing. In the July figures they were down 0.8%. All four types rose in the month, by between 0.8% and 1.0%.
A first-time buyer paid an average of £270,046, up 1.8%. A home mover, someone selling one home to buy the next, paid £417,737, up 1.9%. The step from one to the other is £147,691.
How Southend compares with the rest of Essex
| Area | Average price | Change on a year |
|---|---|---|
| Maldon | £406,165 | +5.0% |
| Harlow | £317,113 | +3.9% |
| Epping Forest | £536,719 | +2.1% |
| Southend-on-Sea | £327,570 | +1.8% |
| Rochford | £408,883 | +1.3% |
| Colchester | £297,638 | +0.9% |
| Basildon | £367,920 | +0.8% |
| Braintree | £324,264 | +0.5% |
| Brentwood | £520,447 | +0.2% |
| Uttlesford | £465,802 | -0.5% |
| Castle Point | £368,191 | -0.7% |
| Thurrock | £322,338 | -0.7% |
| Chelmsford | £378,412 | -0.8% |
| Tendring | £258,932 | -2.2% |
| Essex (county council area) | £360,791 | +0.5% |
| East of England | £338,357 | +0.7% |
| England | £292,998 | +0.8% |
Southend is the ninth dearest of the 14 areas. Its neighbours both cost more: Castle Point by £40,621 and Rochford by £81,313. Castle Point fell 0.7% on the year while Southend rose.
Southend was third fastest in the month, behind Castle Point (2.5%) and Epping Forest (2.0%). Braintree fell furthest in the month, by 1.8%.
What it means for you
- Selling a house: semis are up 3.2% and terraces 2.6% on a year, so the market is still moving your way.
- Selling a flat: expect a price close to last year’s, not above it.
- Buying: recent months are provisional and are often revised, so treat a single month’s change with care.
You can look up what any individual home sold for on the HM Land Registry price paid search.
A note on revisions
The Land Registry revises recent months as late sales are registered. We reported July’s average as £328,383, up 1.6% on the year. In this release July stands at £327,074, up 1.2%. We have added a note to that story.
Have your say